
School Analytics Dashboard for Principals
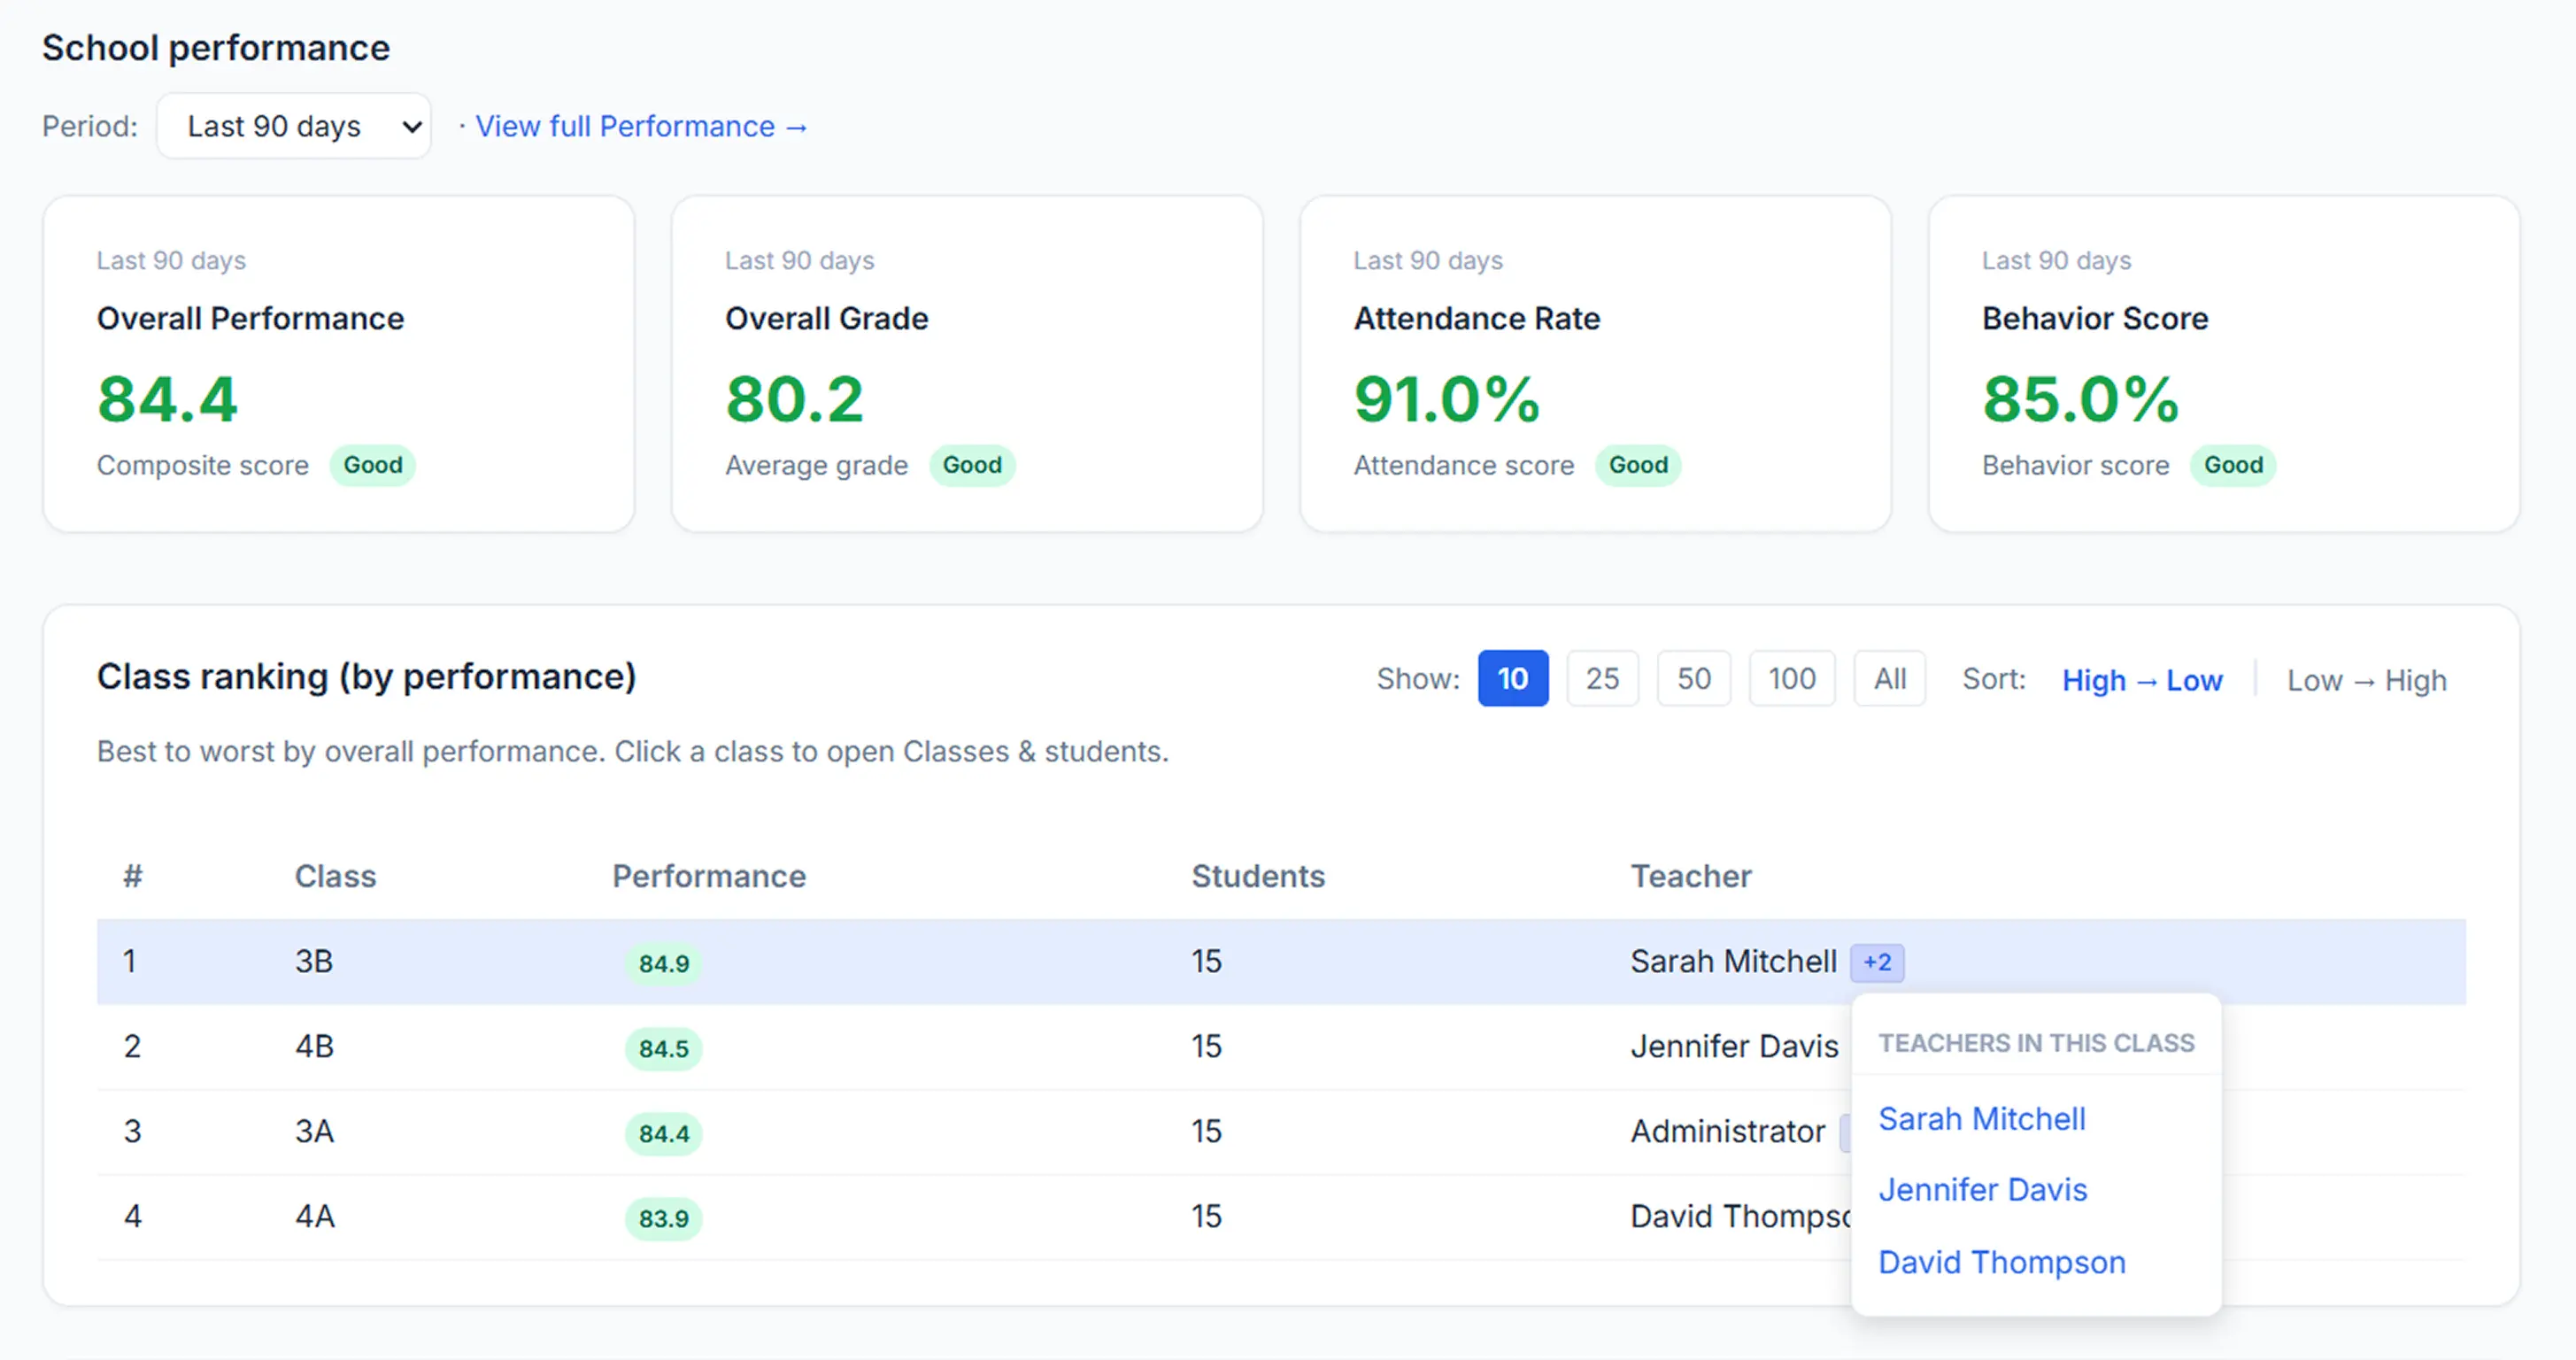
A principal should not have to request a report to find out how the school is doing. Lekktura aggregates the grades, attendance, and behavior your teachers are already recording into a live school view, so trends are visible while there is still time to act on them.
- No separate reporting step
- Trends across the whole school
- Built for support, not ranking
No credit card required · Set up in days, not months
Reporting that does not create work
The most common reason school dashboards go stale is that they depend on someone compiling data specifically for them. Any view that requires extra work eventually reflects the last time someone had time to do that work.
Here the analytics are a by-product of ordinary teaching. If teachers are recording grades and attendance, the school view is current by definition — nobody has to produce it.
What the view answers
The dashboard is built around the questions school leaders actually ask during a term, rather than around every chart that could be drawn.
Which classes or subjects are trending down this period
Where attendance is deteriorating before it becomes chronic
Which students are showing signals in several subjects at once
How results and attendance compare across classes in the school
Where recording has stopped, which usually means a rollout problem
Spotting rollout problems, not just student problems
The most valuable early signal a school dashboard gives is often about the staff, not the students: a class where nothing has been entered for a fortnight.
That gap almost never means the class is fine. It means a teacher has quietly stopped using the system, a timetable change was not reflected, or a new starter never got set up. Catching it in week three is a five-minute conversation. Catching it at the end of term is a lost term of data.
Drilling from school to student
A school-level number is only useful if you can find out what is behind it. The view moves from the whole school to a class, to a subject, to an individual student record — the same records the teacher is looking at, not a separate reporting copy that may disagree.
Because leadership and teachers work from the same data, meetings do not start with an argument about whose numbers are right.
A deliberate stance on evaluation
Aggregated data is presented for support and improvement rather than as a staff ranking. This is a product decision, not a limitation: dashboards that feel like surveillance reliably reduce the honesty of the data being entered, and the data is the whole asset.
Schools that use the school view to ask "who needs help here" get better data over time. Schools that use it to ask "who is underperforming" get a system their staff learn to manage rather than use.
Which schools this fits
A school data dashboard is only worth having if somebody acts on it. That makes leadership capacity, not school size, the deciding factor for student performance analytics.
It suits schools where one or two people carry the whole operational picture and have no analyst to lean on.
Principals who currently request reports instead of opening a dashboard
Private schools and charter schools reporting to a board or trustees
Small districts without a data or MIS team
Schools tracking the effect of an intervention across a term
Leadership teams sharing one operational view across roles
Schools that need current numbers before a parent evening
What to check when comparing school analytics
Analytics is the easiest thing to demo and the hardest to keep alive. Useful questions before buying:
-
1
Whether the dashboard needs anyone to compile or upload anything
-
2
How current the data is — today, last week, or last reporting cycle
-
3
Whether you can drill from a school number to the underlying student record
-
4
Whether leadership and teachers see the same underlying data
-
5
Whether it surfaces gaps in recording, not just student performance
-
6
What happens to the view when one department stops using the system
Questions before you start
Short answers to what schools ask most.
What is a school analytics dashboard?
It is a single view that aggregates grades, attendance, and behavior across every class in a school, so leadership can see trends without requesting reports. Because it is built from data teachers already record, it reflects the current state rather than the last reporting cycle.
Does it require extra data entry?
No. The dashboard is generated from the grades, attendance, and behavior teachers record as part of normal lessons. There is no separate reporting step, which is the usual reason school dashboards fall out of date within a term.
Is it used to evaluate teachers?
It is designed for support and improvement rather than staff evaluation. Aggregated trends help identify where classes or students need attention. Presenting the same data as a staff ranking tends to degrade the quality of what gets recorded, which defeats the purpose.
Can I see an individual student from the school view?
Yes. The view moves from the whole school down to a class, a subject, and an individual student record. It is the same record the teacher works with, so leadership and staff are never comparing two different versions of the same student.
How current is the data?
It reflects what teachers have recorded, so it is as current as the last lesson entered. There is no overnight batch or end-of-term consolidation step between a teacher saving a mark and a principal being able to see it.
Can school administrators see the dashboard too?
Yes. Principals and school administrators both see the school-wide view, while teachers see the classes they are assigned to. This lets a school share the day-to-day operational load without widening access to student data unnecessarily.
Is this a principal dashboard?
Yes. It is the school-wide view a principal or head of school opens to see grades, attendance, and behavior across every class, without asking staff to prepare anything. School administrators see the same view.
How is this different from end-of-term reports?
End-of-term reports describe a period that has already finished. This reflects what teachers recorded in the last lesson, so a class trending down in week four is visible in week four, while the term can still be changed.
More for schools
Other parts of the platform your school will use every day.
Run Your School's Daily Academic Workflow in One Place
Create your school, invite teachers by email, and start recording real grades and attendance during the pilot. No installation, no IT project.
30-day free pilot · No credit card required