1
Filter & Select
Choose your class, subject, and date range (7–30–90 days, 1 year) — your analytics dashboard is ready with real-time data.
Choose Class
Pick Date Range
Track grades, attendance, and behavior in one place. Real-time charts, progress monitoring (RTI/MTSS), standards-based insights, and parent-teacher conference reports.
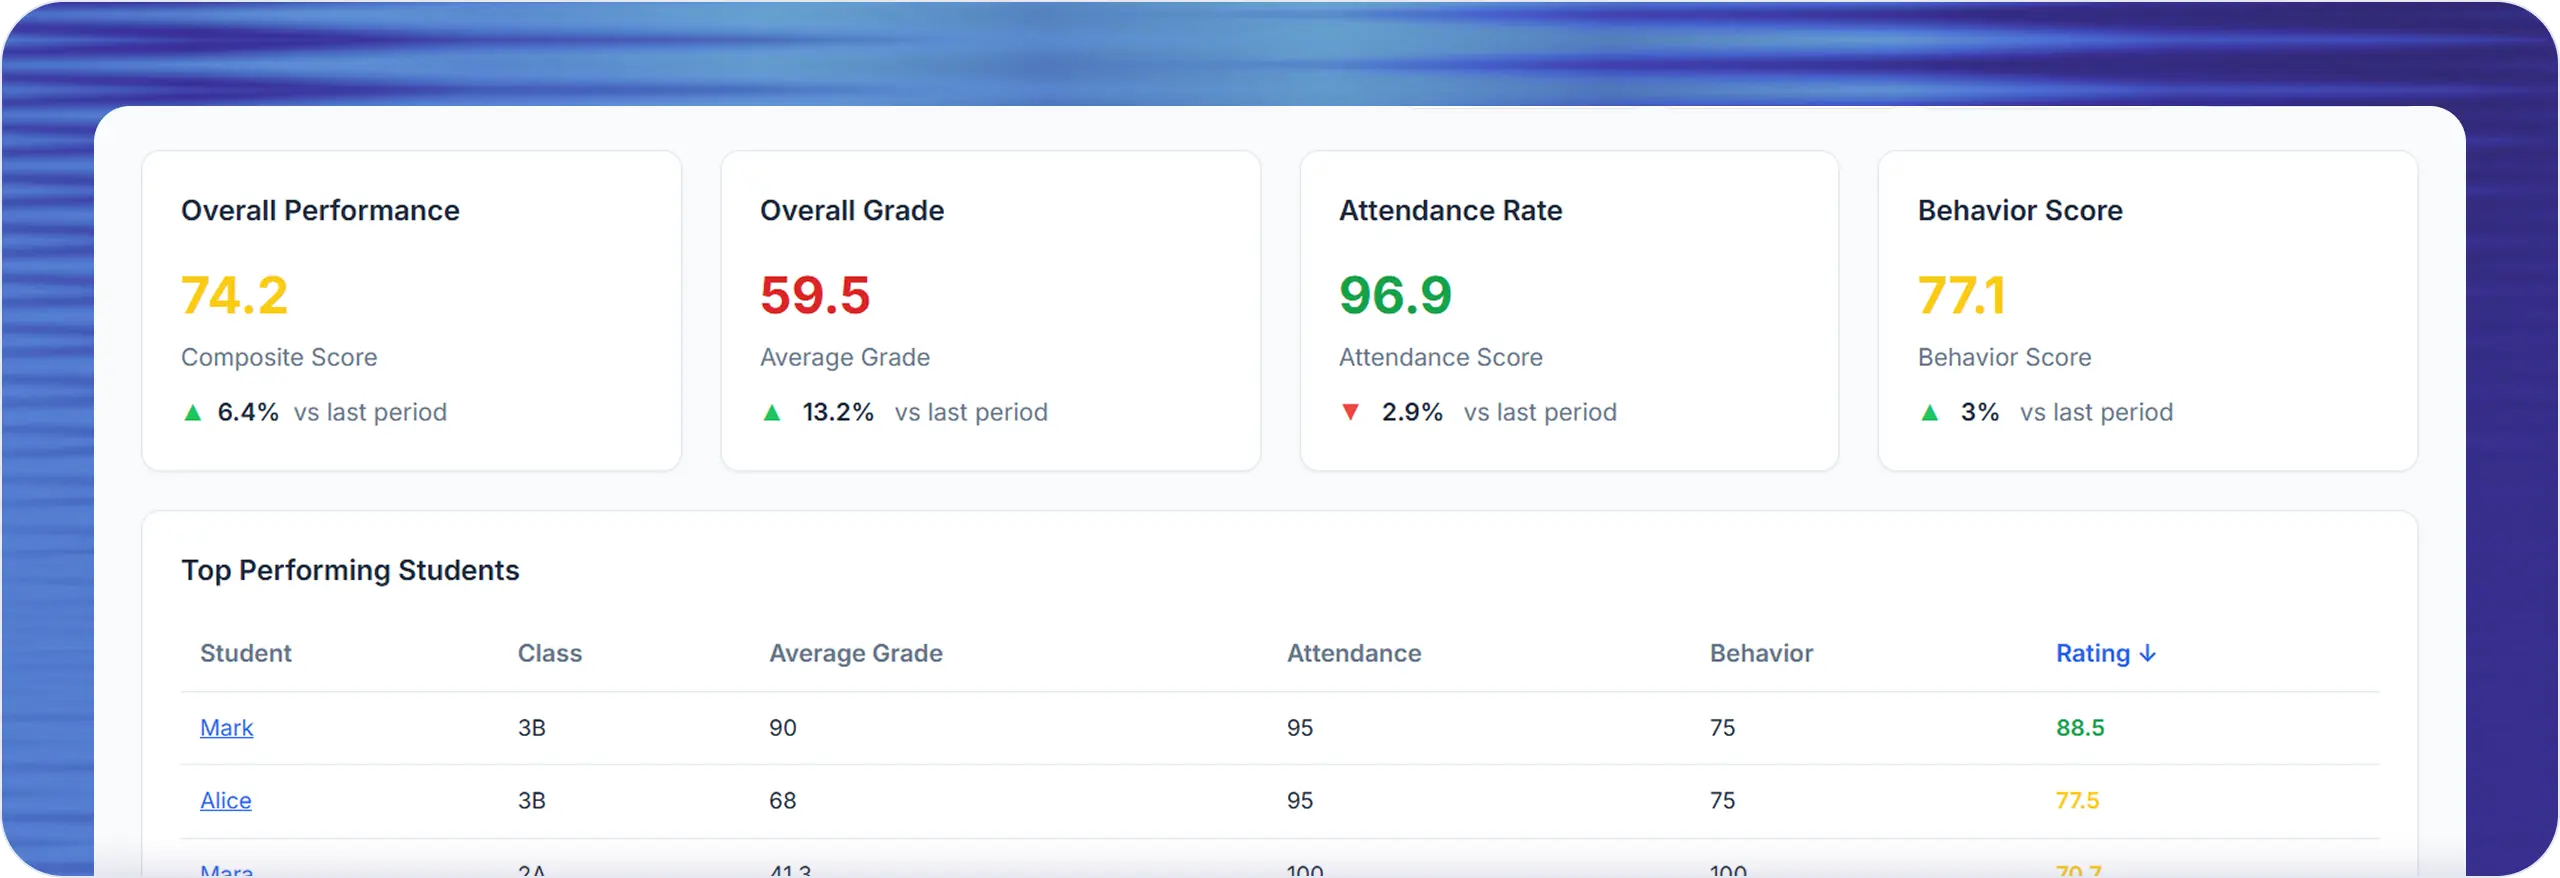
See a clean snapshot of Overall / Grade / Attendance / Behavior. Switch ranges, filter classes/subjects, and dive deeper with the interactive chart.
Get instant insights into overall class performance with composite scores, grade trends, and comparative analytics across different time periods.
Monitor attendance patterns, identify trends, and spot students who may need additional support with detailed attendance analytics and visualizations.
Track positive and negative behavior patterns, identify triggers, and measure the effectiveness of your classroom management strategies.
Monitor individual student growth, identify top performers, and spot students who need additional support with detailed progress tracking.
Visualize data with beautiful, interactive charts that make it easy to understand trends and share insights with parents and administrators.
Generate detailed reports for parent conferences, administrative reviews, and IEP meetings with customizable date ranges and filters.
See Overall (composite) and Average Grade with period-over-period trends. Filter by date range, class, and subject; open an interactive chart to compare Grade / Attendance / Behavior lines.
Track student performance with "vs last period" trend indicators and color-coded changes
Composite score combining grades, attendance, and behavior for complete student assessment
Filter by Date Range, Class, and Subject to focus on specific data and time periods
Toggle Grade / Attendance / Behavior / Overall lines to compare trends and patterns visually
Monitor Attendance Rate with color-coded trend. View attendance alongside grades and behavior on the chart; filter by date, class, and subject.
Monitor attendance patterns with color-coded trend indicators and period-over-period comparisons
Focus on specific data and time periods with smart filtering options
View attendance trends alongside grades and behavior in interactive charts
Individual student attendance data integrated into detailed profiles
See Behavior Score with period-over-period trend. Compare behavior with grades and attendance on the chart; filter by date, class, and subject.
Track behavior patterns with color-coded trend indicators and period-over-period comparisons
Show or hide behavior trends in interactive performance charts
Analyze behavior trends alongside academic performance and attendance data
Individual student behavior data integrated into detailed profiles
Open a student profile and use Print Results to generate a concise page with Average Grade, Attendance, Behavior, and the selected date range.
Generate a student-ready page for meetings in one click - includes key metrics and trends for parent conferences and administrative reviews.
Three simple steps — designed to fit your daily routine.
Choose your class, subject, and date range (7–30–90 days, 1 year) — your analytics dashboard is ready with real-time data.
Open interactive charts and toggle Grade / Attendance / Behavior / Overall lines to see trends and patterns instantly.
Sort and search the Top Students list, then open student profiles to see trends, recommendations, and print results for conferences.
Enter data for John Smith and Alice Sunshine to see real-time analytics updates
Enter grades to see results
Select attendance to see results
Select behavior to see results
Combined metrics
Everything you need to understand and improve your classroom performance.
Monitor student progress in real-time with comprehensive dashboards that show grades, attendance, behavior, and overall performance trends. Get instant insights into what's working and what needs attention.
Transform complex data into clear, actionable insights with interactive charts and graphs. Share visual reports with parents and administrators to demonstrate student progress and classroom effectiveness.
Make data-driven decisions that improve student outcomes and save you time.
Automatically generate reports and insights instead of manually analyzing data. Focus on teaching while analytics work in the background.
Spot trends and patterns that might otherwise go unnoticed. Identify struggling students early and adjust your teaching strategies accordingly.
Share concrete data with parents and administrators. Show progress with visual evidence and make more compelling arguments for student support.
Join teachers who are already using analytics to improve student outcomes and save time.
No credit card required • Free to start • Cancel anytime
Everything you need to know about Analytics Dashboard.
Your student data is protected with industry-standard security measures. We prioritize privacy and data protection for all educational users.
Trusted by educators across all grade levels and school types.
K-5 classroom management
6-8 grade tracking
9-12 analytics
Student support teams
Complete your classroom management toolkit