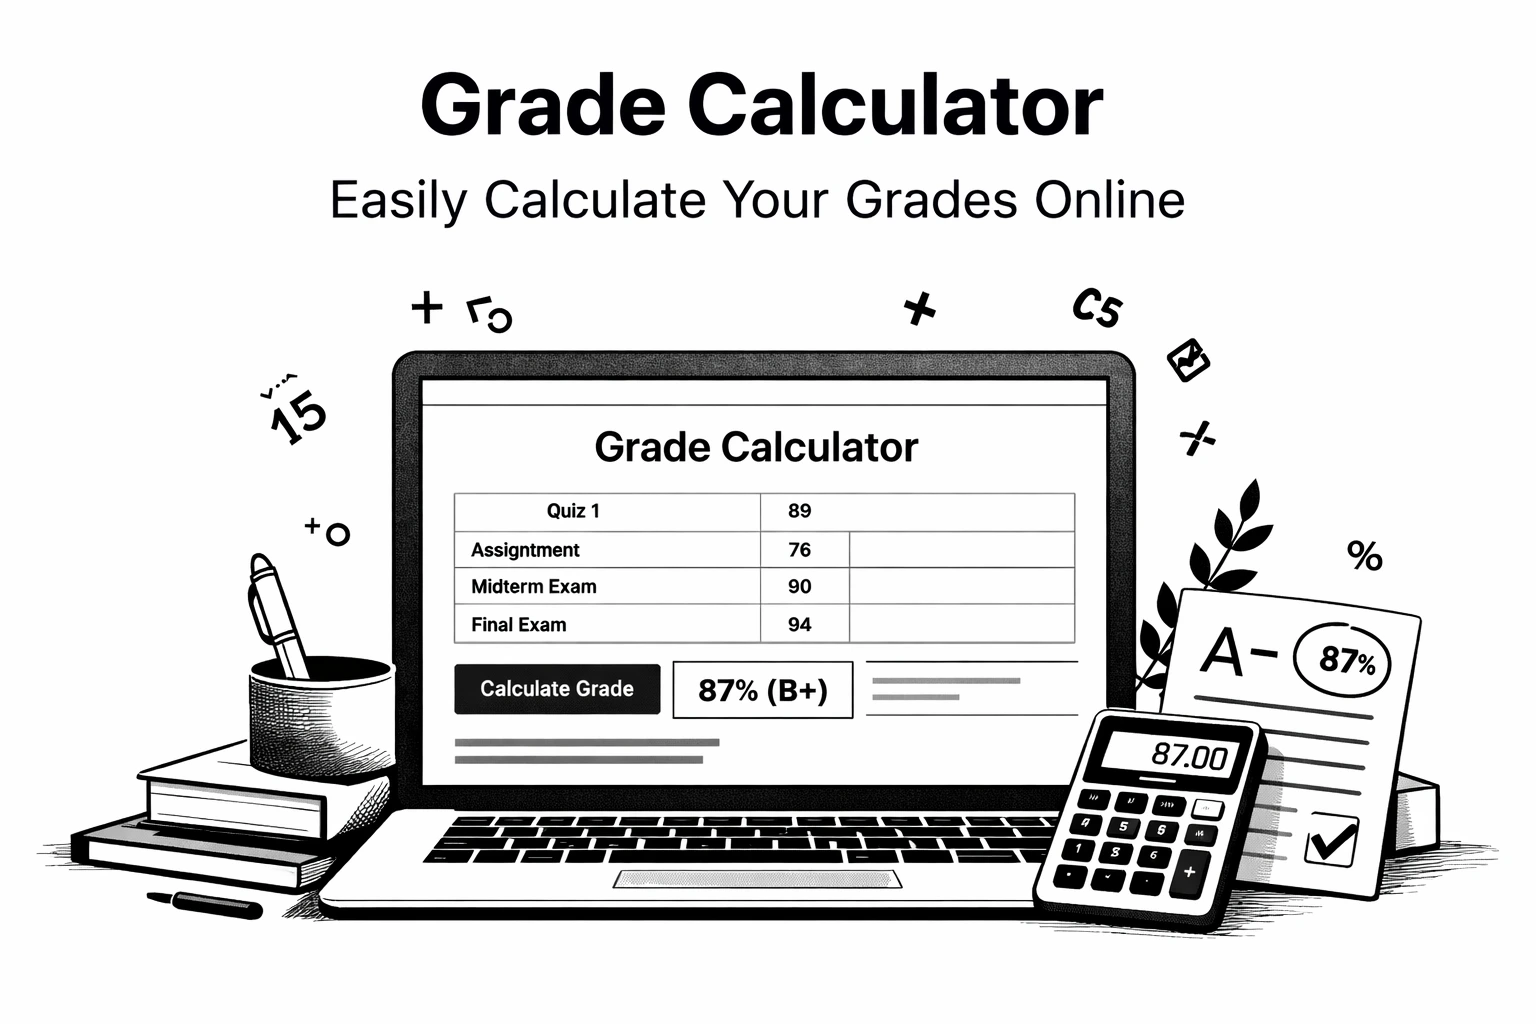
Creating a fair, transparent gradebook starts with choosing one method and sticking to it. This guide explains points‑based vs. weighted categories, shows step‑by‑step examples (with real numbers), and answers common questions like “What grade do I need on the final?”, “How do I drop the lowest score?”, and “How do I handle missing work or extra credit?”. Use it to set up your gradebook once and avoid mid‑term surprises.
Summary
A practical, teacher‑friendly walkthrough for calculating grades in K–12. You’ll see simple formulas, fully worked examples, and quick rules for rounding, late work, and category weights.
Table of Contents
- The Two Main Methods (Points vs. Weighted)
- Which Method Should I Use?
- Points‑Based Method: Formula + Examples
- Weighted Categories: Formula + Examples
- Mixed Setups (participation, projects, finals)
- Dropping the Lowest Score (fairly)
- Missing Work, Zeros, and Late Penalties
- Extra Credit (without breaking the scale)
- Converting Percent → Letter Grade
- Frequently Asked Questions
The Two Main Methods
Points‑based: Every assignment is worth points. The final grade is earned points ÷ possible points.
Weighted categories: You group assignments (Homework, Quizzes, Tests, Projects) and assign each group a percentage weight that sums to 100%. Each category average is multiplied by its weight; then you add the results.
Both methods can produce the same overall grade if set up carefully, but they behave differently when the number of assignments varies by category.
Which Method Should I Use?
- Choose points‑based if you want a simple system where big tasks naturally carry more weight because they have more points (e.g., a 100‑point test counts more than a 10‑point exit ticket).
- Choose weighted categories if you want fixed emphasis regardless of how many assignments you give (e.g., Tests 50%, Quizzes 30%, Homework 20%). This protects against “homework overload” drowning out test performance—or the reverse.
Tip: Communicate the method to families up front and show one example. Transparency avoids grade disputes later.
Points‑Based Method: Formula + Examples
Formula
Final % = (Sum of Earned Points ÷ Sum of Possible Points) × 100
Example A (straight points)
Assignments and scores:
- Homework set (10/10)
- Quiz (16/20)
- Project (45/50)
- Test (84/100)
Totals: 155 earned ÷ 180 possible = 0.861… × 100 = 86.1%
Example B (with extra credit points)
Add +5 extra credit to earned points (possible points unchanged): 160 ÷ 180 = 88.9%. Extra credit pushes the numerator up but does not inflate the denominator.
Pros: dead simple, easy to explain.
Cons: if you post more small items in one category, that category can dominate unintentionally.
Weighted Categories: Formula + Examples
Formula
Final % = (Category Avg₁ × Weight₁) + (Category Avg₂ × Weight₂) + ...
Weights are expressed as decimals (e.g., 30% = 0.30). Category averages are the mean of scores within the category, usually in percent.
Example C (Homework 20%, Quizzes 30%, Tests 50%)
Category averages:
- Homework average = 92%
- Quizzes average = 78%
- Tests average = 85%
Calculation:
(92 × 0.20) + (78 × 0.30) + (85 × 0.50)
= 18.4 + 23.4 + 42.5
= 84.3%
Example D (projects and participation included)
Weights: Homework 15%, Quizzes 25%, Projects 30%, Tests 25%, Participation 5%
Category averages: 90, 82, 88, 84, 95
(90×0.15) + (82×0.25) + (88×0.30) + (84×0.25) + (95×0.05)
= 13.5 + 20.5 + 26.4 + 21.0 + 4.75
= 85.75%
Pros: stable emphasis; matches many district policies.
Cons: requires careful setup and clear communication; mistakes with category totals can skew results.
Mixed Setups (final exams, project showcases)
If your class has a final exam or capstone project, you can either:
- Make it a large points item (e.g., 200 points) in a points‑based gradebook; or
- Create a special Finals category with a fixed weight (e.g., 10–20%) in a weighted gradebook.
To answer “What do I need on the final?”, rearrange the weighted formula:
Needed Final % = (Target Final Grade − Sum(Completed Category % × Weight)) ÷ Final Weight
Example: You target 90%. Completed weighted sum is 72% so far. Final weight = 20%.
Needed on final = (90 − 72) ÷ 0.20 = 90% on the final.
Dropping the Lowest Score (fairly)
If policy allows, dropping a low score rewards consistency without giving away points.
Points‑based: remove the selected assignment from both earned and possible totals, then recompute the percentage.
Weighted: remove the score inside its category before averaging that category. Never drop across categories unless your policy says so.
Avoid dropping assessments that measure unique standards; otherwise you may weaken the evidence for mastery.
Missing Work, Zeros, and Late Penalties
- Zeros are mathematically harsh. One zero in a small gradebook can sink an average far below what performance on other work suggests. Consider incomplete (INC) until a minimum piece of evidence is submitted. If you must score missing work, some schools use a minimum floor (e.g., 50%) to keep the scale proportional while still signaling missing learning.
- Late work: Define a simple rule (e.g., −10% per class day up to −30% max) and apply it consistently. Keep the focus on evidence of learning, not on point deductions alone.
- Make‑up windows: Publish clear deadlines (e.g., one week after absence) and provide office‑hours options.
Extra Credit (without breaking the scale)
- Prefer standards‑aligned extra credit (optional challenge problems) rather than unrelated tasks.
- In a points system, add to earned points but keep possible points the same.
- In a weighted system, keep extra credit within the smallest‑weight category or use a separate 0‑weight category that converts to points only at the end (to avoid distorting weights).
Converting Percentage → Letter Grade
Define the conversion once and publish it. Common scales:
- Traditional: A 90–100, B 80–89, C 70–79, D 60–69, F <60
- Plus/Minus: A 93–100, A− 90–92, B+ 87–89, B 83–86, …
- Standards‑based: convert performance levels to reporting bands only if your district requires a percentage equivalent.
State explicitly whether you round (.5 and above) or truncate.
Frequently Asked Questions
Is weighted better than points?
Neither is “better” universally. Weighted makes emphasis explicit; points is simpler. Choose based on how you want tests, projects, and practice to affect the final.
How do I handle categories with very few assignments?
In weighted systems, even two tests can carry 50%. Communicate this early, and consider minimum‑items rules (e.g., at least 3 items per weighted category) to stabilize averages.
What about rubrics?
Rubric scores (e.g., 4‑point) can be converted to percentages before entering, or you can keep them in a standards‑based column and report separately.
Can I curve a test?
If you curve, document the rule (e.g., +5 raw points or scale to a mean of 80%). Apply it to all students equally and explain in your syllabus.
How do I make the math transparent to families?
Include one filled‑in example in the syllabus and post a short video showing the steps.
Quick Start Checklist
- Pick one method (points or weighted) and write it at the top of your syllabus.
- Enter sample assignments and verify the math before students arrive.
- Decide late work and make‑up rules; publish them.
- Decide whether you round or truncate.
- Share a one‑page “How your grade is calculated” overview with families.


