Behavior Data Collection for RTI Tier 2 Interventions: A Step-by-Step Guide
Introduction
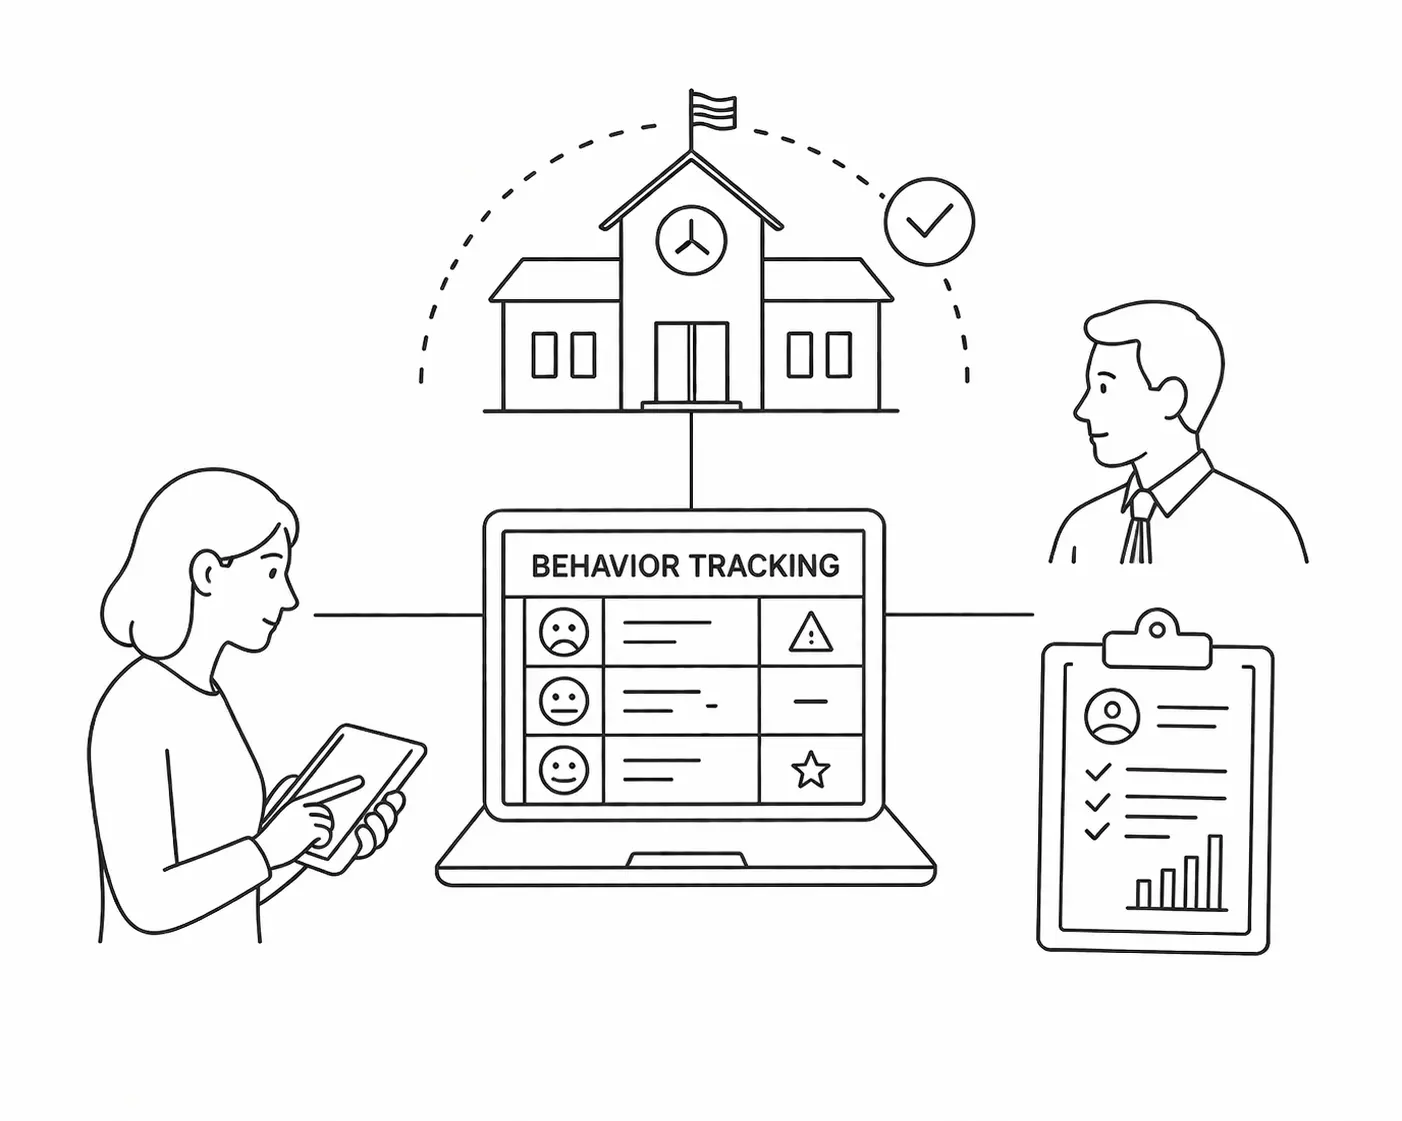
Behavior Data Collection for RTI Tier 2 Interventions is your roadmap to turning classroom observations into clear, actionable insights. By systematically gathering frequency counts, duration measures, intensity ratings, and contextual ABC data, educators can set precise baselines, spot trends early, and adjust interventions before small issues become big barriers to learning. In this guide, you’ll discover how to define target behaviors, choose the right data-collection methods, train your team, and leverage technology to make progress monitoring both efficient and meaningful. Let’s dive into nine proven strategies that will transform guesswork into data-driven success.
Understanding RTI Tier 2 and the Importance of Behavior Data
RTI Tier 2 supports roughly 10–15% of students who need more than universal (Tier 1) supports but aren’t yet at the level of individualized (Tier 3) plans. These students often display:
- - Persistent off-task behaviors
- - Mild aggression or defiance
- - Social skill deficits
- - Difficulty following routines
Without data-driven decision making, teams rely on recollection and anecdote—methods prone to bias and delay. Systematic behavior data:
1) Establishes a Concrete Baseline. Know exactly how often a behavior occurs before any intervention.
2) Monitors Progress Objectively. Charts and graphs reveal trends faster than memories can.
3) Guides Timely Adjustments. Use the “four-point rule” (four consecutive data points up or down) to decide when to tweak strategies.
In short, robust data collection is the engine that powers effective RTI Tier 2 behavior interventions.
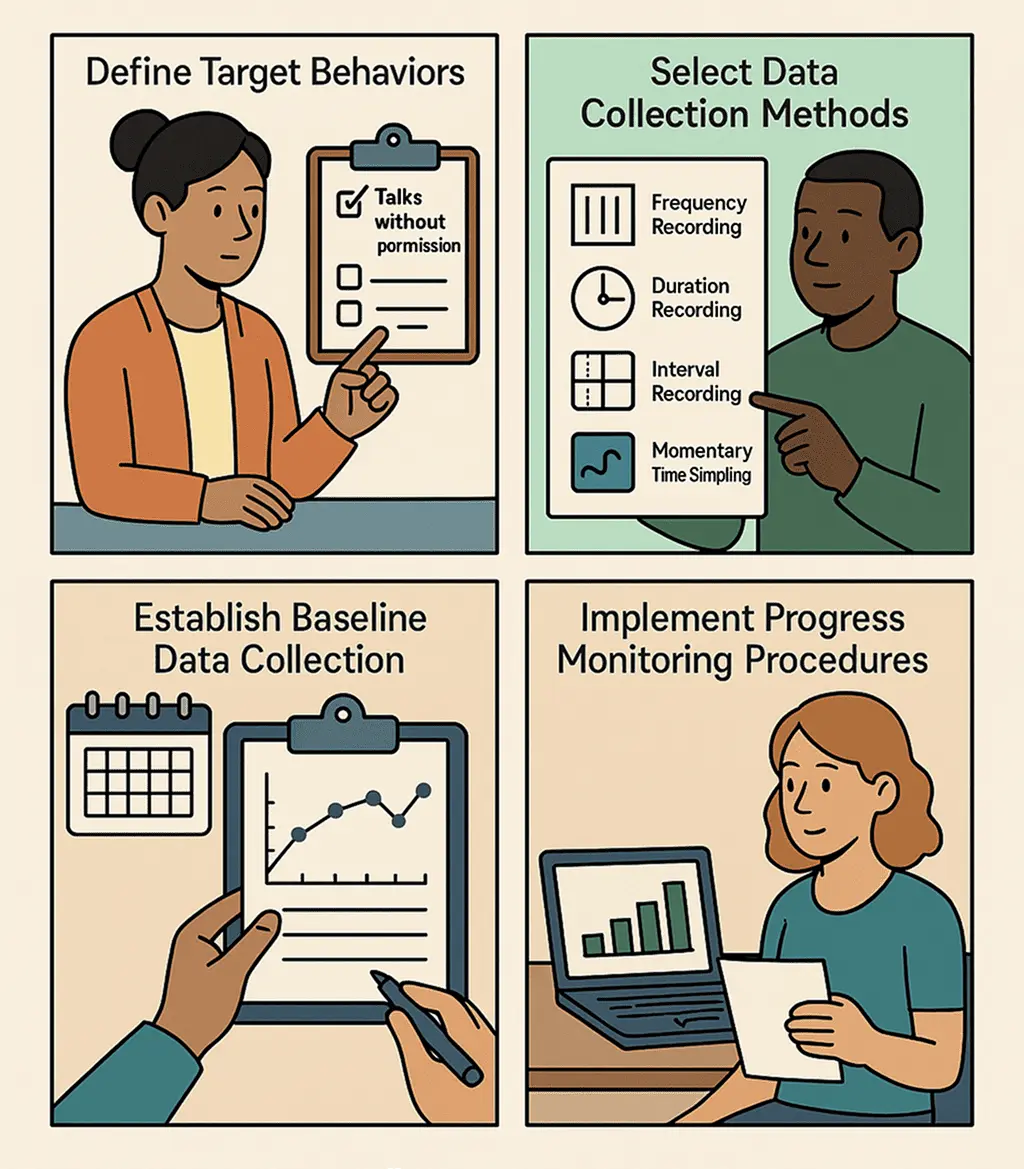
Identifying and Defining Target Behaviors
Observable vs. Covert Behaviors
- - Observable Behaviors are actions you can see or hear: calling out, leaving a seat, throwing materials.
- - Covert Behaviors occur internally—anxiety, daydreaming—but you can measure proxies (e.g., “eyes off task for more than 10 seconds,” “hands in lap but not writing”).
Tip: Break vague terms like “non-compliance” into specific, observable steps. For example, define it as “fails to respond to two consecutive teacher requests within five seconds.”
Applying the “Stranger Test”
1) Write the definition: “Student speaks without permission during instruction.”
2) Give it to a colleague unfamiliar with the student.
3) Have them record three instances based solely on your definition.
4) Compare logs: An 80–90% match means your definition is clear; lower agreement calls for refinement.
Passing the Stranger Test ensures inter-observer reliability, a cornerstone of valid data.
Key Components of Effective Behavior Data Collection
1) Frequency – How often does the behavior occur?
2) Duration – How long does each instance last?
3) Intensity – On a scale (e.g., 1–5), how severe is the behavior?
4) Context (ABC Analysis) – What happened before (Antecedent), during (Behavior), and after (Consequence)?
Combined, these measures give you a 360° view of student actions.
Frequency Recording Methods
- - Tally Sheets: Quick check-offs during observation periods.
- - Event-Recording Apps: One-tap timestamp logging on a tablet or phone.
Duration Measurement Strategies
- - Stopwatch Timing: Start at the behavior’s onset, stop when it ends.
- - Cumulative Logs: Add up brief, repeated episodes within a session.
Intensity Rating Scales
- - Anchored Scales (1–3 or 1–5): Each number pairs with a concrete descriptor (e.g., “3 = pushes peer, knocks over chair”).
Antecedent-Behavior-Consequence (ABC) Analysis
- - Log triggers (transitions, peer proximity), the behavior itself, and the outcome (teacher attention, removal).
- - Use ABC patterns to adjust environmental or instructional supports.
Selecting Appropriate Data Collection Methods
1. Whole-Interval Recording
- - What it is: You mark the interval only if the target behavior was present for the entire block of time.
- - Best for: Measuring sustained behaviors you want to see maintained (e.g., staying on-task, keeping hands in lap).
2. Partial-Interval Recording
- - What it is: You mark the interval if the behavior occurred at any point during the block, then wait until the next interval.
- - Best for: Capturing high-rate behaviors where you just need to know it happened at least once (e.g., calling out, tapping a desk).
3. Momentary Time Sampling
- - What it is: At the end of each interval, you observe and record whether the behavior is occurring at that exact moment.
- - Best for: Tracking continuous behaviors without a clear start/end (e.g., on-task engagement, peer interactions).
4. Interval Recording
- - What it is: Divide your observation period into equal time blocks; during each block, note whether the behavior happened at any time.
- - Best for: Medium-rate behaviors when you can’t watch continuously but still want a reliable estimate of occurrence.
Tip:
Mix and match methods to fit your class routine—for example, use frequency tallies during direct instruction and momentary sampling during independent work.
Establishing Baseline Data
Before you introduce any Tier 2 intervention:
1) Collect for 5–7 Days: Gather data during the same activities and times (e.g., math class if off-task behavior spikes there).
2) Note Environmental Variables: Record staffing changes, time of day, unusual events.
3) Graph the Results: Create a simple line or bar graph to visualize typical behavior levels.
A solid baseline ensures you can spot real change once interventions begin.
Designing User-Friendly Data Collection Tools
Paper-Based Forms
- - Pros: No tech needed, always accessible.
- - Cons: Can get lost; manual graphing required.
Mobile Apps & Online Platforms
- - Pros: One-tap entries, auto-generated graphs, secure data storage.
- - Cons: Subscription costs, relies on device availability.
A balanced approach is best: keep backup paper forms even if you use tech tools. For ready-made templates and digital options, check the Council for Exceptional Children’s resources on behavior tracking forms: https://exceptionalchildren.org.
Or https://www.teacherspayteachers.com
Training Your Team for Reliable Data Collection
1) Initial Workshops: Review definitions, demo tools, practice with video clips.
2) Reference Cards: Pocket guides with behavior definitions and data steps.
3) Inter-Observer Reliability Checks: Biweekly tandem observations; aim for ≥ 80% agreement.
4) Regular Debriefs: Share challenges, troubleshoot inconsistencies, refresh skills.
Consistent training builds confidence, ensuring every team member records data the same way.
Implementing Progress Monitoring Procedures
- - Frequency: Collect data at least 2–3 times per week during Tier 2 interventions.
- - Visualization: Plot baseline and intervention data side by side.
- - Goal Lines: Draw target improvement levels (e.g., 25% reduction in frequency).
- - Decision Rules: Apply the four-point rule—four consecutive data points above or below the baseline trend signals a need to adjust.
Clear visuals help teams celebrate gains and pivot when progress stalls.
Analyzing Data for Data-Driven Decision Making
1) Trend Identification: Focus on patterns, not single outliers.
2) Percentage Change: Calculate improvement rates [(Baseline – Current) ÷ Baseline] × 100.
3) Contextual Insights: Use ABC logs to pair data shifts with environmental changes.
4) Team Meetings: Review graphs, discuss fidelity, decide next steps—continue, tweak, or escalate.
Data analysis turns raw numbers into meaningful action plans.
Addressing Common Data Collection Challenges
Time Constraints
- - Challenge: Finding uninterrupted time to observe and record behaviors during busy classroom periods.
- - Solution: Use momentary time sampling during natural transitions (e.g., lining up, handing out materials) to capture snapshots without adding extra work.
Inconsistent Definitions
- - Challenge: Different staff interpret behavioral definitions differently, leading to unreliable data.
- - Solution: Hold brief mini-trainings to revisit operational definitions.
- - Refine and discuss clear examples vs. non-examples.
- - Use video clips or role-plays to illustrate each point.
Lost Paper Forms
- - Challenge: Paper tracking sheets frequently go missing or get damaged, creating data gaps.
- - Solution:
- - Keep duplicate copies of all forms in a locked drawer or binder.
- - Maintain a central digital backup (scanned PDFs or shared drive) so data can be retrieved if originals disappear.
Multiple Students to Track
- - Challenge: Tracking more than one student at a time strains resources and can reduce data quality.
- - Solution:
- - Stagger start dates for different students’ data collection windows.
- - Enlist paraeducators or peer mentors to share observation duties, focusing each person on one student at a time.
By anticipating these common hurdles and applying targeted solutions, your behavior data collection system will stay consistent, reliable, and sustainable.
Modifying Interventions Based on Data Insights
- - Minimal Progress (<25% Improvement in 6 Weeks):
- - Increase session frequency or duration
- - Introduce new supports (visual schedules, self-monitoring)
- - Audit implementation fidelity
- - Significant Progress (>50% Improvement):
- - Gradually fade supports (“fading”) while maintaining data checks
- - Document each step to prevent regression
Data-guided tweaks ensure interventions stay aligned with student needs.
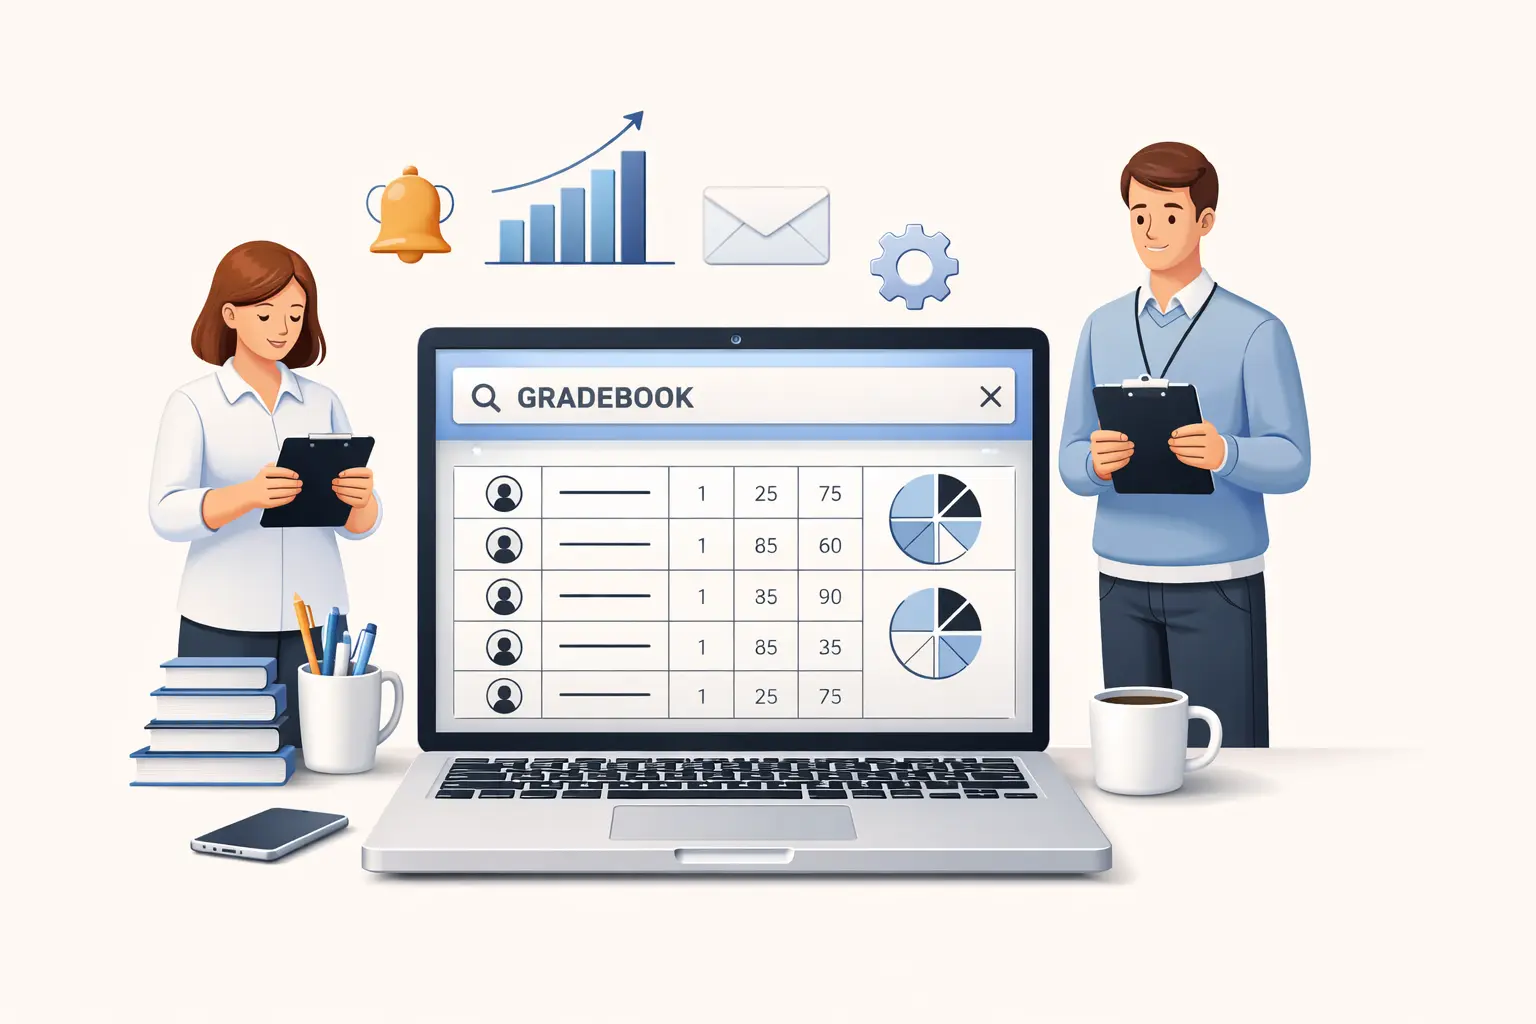
Leveraging Technology for Efficient Data Tracking
- - Behavior Management Software: ClassDojo, PBISApps, BehaviorSnap offer quick logging and auto-graphs.
- - Mobile Accessibility: Tablets and smartphones let you record incidents in real time.
- - Data Export and Reporting: Generate PDF/Excel files for RTI meetings without manual entry.
Always pair digital tools with paper backups to guard against outages.
Building Sustainable Data Collection Practices
- - Embed in Daily Routines: Tie data entry to morning attendance checks or homework collection.
- - Solicit User Feedback: Quarterly surveys—what’s working? What’s too clunky?
- - Recognize Success: Highlight teachers or aides who maintain high-quality data at staff meetings.
Sustainability comes from simplicity, support, and celebration.
Frequently Asked Questions (FAQs)
1) Do I need to collect data every day?
No, 2–3 times weekly often suffices if you see clear trends.
2) How many behaviors should I track at once?
Aim for 1–3 target behaviors to keep data reliable.
3) Which method is best: frequency or duration?
If behaviors are brief and occur often (e.g., calling out), use frequency. For prolonged actions (e.g., tantrums), measure duration.
4) What if I can’t find the time during instruction?
Use momentary time sampling during transitions or independent work.
5) When should I consider Tier 3 supports?
If after 6 weeks you see <25% improvement and fidelity is high, plan for more intensive interventions.
Conclusion: Maximizing Impact with Reliable Data
Implementing Behavior Data Collection for RTI Tier 2 Interventions is an investment that pays off through clearer insights, more targeted supports, and measurable student wins. Start by defining behaviors precisely, choose methods that fit your context, train your team thoroughly, and lean on technology wisely. With sustainable routines and data-driven decision making, you’ll streamline intervention planning, boost student engagement, and foster real behavioral growth. Empower your RTI team with robust data—and watch meaningful change unfold in your classroom.